


The cellular respiration diagram is one of the most important visual tools in biology. It helps students, researchers, and educators understand how cells convert nutrients into usable energy. Cellular respiration is the process by which living organisms break down glucose and other molecules to produce ATP (adenosine triphosphate), the primary energy currency of the cell.
A well-structured cellular respiration diagram illustrates the step-by-step breakdown of glucose, showing how energy is transferred and stored. It highlights the location of each stage, the molecules involved, and the final products. Understanding this diagram makes it much easier to grasp how life sustains itself at the cellular level.
In this detailed guide, we will explore each component of cellular respiration, explain how to interpret a cellular respiration diagram, and describe the biological importance of every stage.
What Is Cellular Respiration?
Cellular respiration is a biochemical process in which cells extract energy from glucose in the presence of oxygen. This energy is stored in ATP molecules, which power nearly all cellular activities.
The overall chemical equation for cellular respiration is:
C₆H₁₂O₆ + 6O₂ → 6CO₂ + 6H₂O + Energy (ATP)
A cellular respiration diagram visually represents this equation and breaks it down into smaller, more detailed steps.
Why the Cellular Respiration Diagram Is Important
A diagram provides clarity by:
- Showing the three main stages of respiration
- Identifying where each stage occurs in the cell
- Illustrating energy flow
- Displaying intermediate molecules
- Simplifying complex chemical reactions
Without a visual representation, understanding cellular respiration can feel overwhelming. The cellular respiration diagram transforms abstract chemical reactions into a structured, easy-to-follow format.
Overview of the Three Main Stages in a Cellular Respiration Diagram
A typical cellular respiration diagram is divided into three major stages:
- Glycolysis
- Krebs Cycle (Citric Acid Cycle)
- Electron Transport Chain (ETC)
Each stage plays a critical role in energy production.
Stage 1: Glycolysis in the Cellular Respiration Diagram
Location
Cytoplasm
Purpose
Breaks down one molecule of glucose into two molecules of pyruvate.
Key Features Shown in the Diagram
In the cellular respiration diagram, glycolysis is usually illustrated outside the mitochondrion because it takes place in the cytoplasm.
Important elements include:
- Glucose (6-carbon molecule)
- Two pyruvate molecules (3-carbon each)
- ATP production
- NADH formation
Energy Output of Glycolysis
- 2 ATP (net gain)
- 2 NADH
- 2 Pyruvate
Although glycolysis produces only a small amount of ATP, it is crucial because it begins the energy extraction process.
Transition Reaction: The Link Between Stages
After glycolysis, pyruvate enters the mitochondrion. The cellular respiration diagram often shows arrows pointing from the cytoplasm into the mitochondria to represent this movement.
During this step:
- Pyruvate converts into Acetyl-CoA
- CO₂ is released
- NADH is produced
This step prepares the molecule for the Krebs cycle.
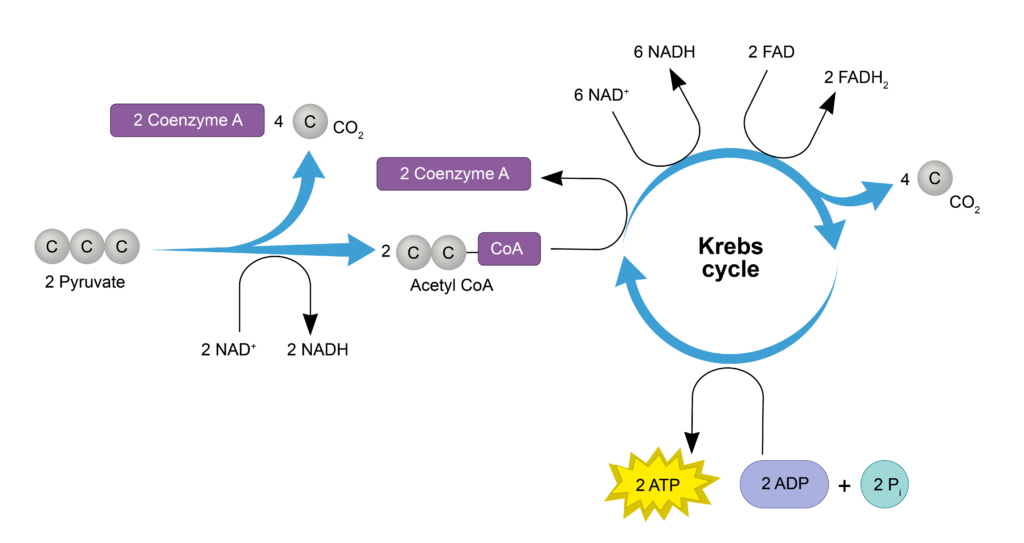
Stage 2: Krebs Cycle in the Cellular Respiration Diagram
Location
Mitochondrial Matrix
Purpose
Extract high-energy electrons and produce electron carriers.
The Krebs cycle is shown as a circular pathway in the cellular respiration diagram, emphasizing its cyclical nature.
What the Diagram Displays
- Acetyl-CoA entering the cycle
- Carbon dioxide being released
- NADH and FADH₂ production
- Small ATP production
Energy Output per Glucose Molecule
- 2 ATP
- 6 NADH
- 2 FADH₂
- 4 CO₂
This stage produces high-energy electron carriers that move to the next phase.
Stage 3: Electron Transport Chain in the Cellular Respiration Diagram
Location
Inner mitochondrial membrane
The electron transport chain is the most productive stage in terms of ATP generation.
Diagram Representation
In the cellular respiration diagram, this stage is shown along the inner membrane of the mitochondrion. It includes:
- Protein complexes
- Electron movement
- Proton pumping
- ATP synthase
- Oxygen as the final electron acceptor
ATP Production
Approximately 32–34 ATP molecules are produced in this stage.
This is where most of the energy from glucose is finally converted into usable ATP.
Structure of the Mitochondrion in a Cellular Respiration Diagram
A complete cellular respiration diagram often includes the structure of the mitochondrion:
- Outer membrane
- Inner membrane
- Cristae
- Matrix
- Intermembrane space
The inner membrane’s folds (cristae) increase surface area, allowing more ATP production.
Aerobic vs Anaerobic Respiration in the Diagram
Some cellular respiration diagrams also compare aerobic and anaerobic respiration.
Aerobic Respiration
- Requires oxygen
- Produces 36–38 ATP
- Occurs in mitochondria
Anaerobic Respiration
- No oxygen required
- Produces 2 ATP
- Results in lactic acid or alcohol
These comparisons help students understand energy efficiency.
Detailed Breakdown of ATP Prodction
| Stage | ATP Produced |
|---|---|
| Glycolysis | 2 |
| Krebs Cycle | 2 |
| Electron Transport Chain | 32–34 |
| Total | 36–38 ATP |
The cellular respiration diagram often labels ATP counts beside each stage.
Role of NADH and FADH₂ in the Cellular Respiration Diagram
These molecules act as electron carriers. In diagrams, they are shown transporting electrons to the electron transport chain.
They are essential for:
- Creating proton gradients
- Driving ATP synthase
- Maximizing energy extraction
Without them, ATP production would be minimal.
Carbon Dioxide and Water Production
The cellular respiration diagram also highlights waste products:
- Carbon dioxide is released during the Krebs cycle
- Water is formed at the end of the electron transport chain
These byproducts are expelled from the body through breathing and other biological processes.
How to Draw a Cellular Respiration Diagram Step-by-Step
If you are asked to draw one:
- Sketch a mitochondrion
- Show glycolysis outside in the cytoplasm
- Draw pyruvate entering mitochondria
- Add circular Krebs cycle
- Show electron transport chain along inner membrane
- Label ATP production at each stage
- Include oxygen and carbon dioxide
Proper labeling ensures clarity.
Common Mistakes When Studying a Cellular Respiration Diagram
Students often:
- Confuse NADH with ATP
- Forget locations of stages
- Ignore transition reaction
- Miscalculate ATP totals
Understanding each part clearly prevents these errors.
Relationship Between Photosynthesis and Cellular Respiration
Many diagrams compare cellular respiration with photosynthesis.
Photosynthesis produces glucose and oxygen.
Cellular respiration uses glucose and oxygen.
They form a biological cycle that sustains life.
Importance of Cellular Respiration in Living Organisms
Cellular respiration powers:
- Muscle contraction
- Brain function
- Growth and repair
- Active transport
- Cellular communication
Without ATP production, cells cannot survive.
Advanced Concepts in the Cellular Respiration Diagram
Chemiosmosis
Movement of protons across a membrane to drive ATP synthesis.
Oxidative Phosphorylation
ATP production powered by electron transfer.
Substrate-Level Phosphorylation
Direct ATP production in glycolysis and Krebs cycle.
These processes are usually labeled in detailed diagrams.
Real-Life Applications of Understanding Cellular Respiration
Understanding the cellular respiration diagram helps in:
- Medical research
- Cancer studies
- Exercise physiology
- Metabolic disorders
- Biotechnology
For example, athletes rely heavily on efficient ATP production.
How Cellular Respiration Differs in Prokaryotes
Prokaryotic cells lack mitochondria. In them:
- Glycolysis occurs in cytoplasm
- Electron transport chain occurs in cell membrane
Diagrams for bacteria look slightly different.
Summary of the Cellular Respiration Diagram
The cellular respiration diagram simplifies a complex biological process into an organized visual system. It clearly shows:
- The breakdown of glucose
- The production of ATP
- The role of oxygen
- The release of carbon dioxide and water
By understanding each stage—glycolysis, Krebs cycle, and the electron transport chain—you gain a complete understanding of how cells generate energy.
Conclusion
The cellular respiration diagram is more than just an illustration; it is a roadmap of life’s energy system. Every living cell depends on this process to survive, grow, and function. From the initial breakdown of glucose in glycolysis to the massive ATP production in the electron transport chain, each step is essential.
Mastering this diagram not only improves your biology knowledge but also strengthens your understanding of how energy flows within living organisms. Whether you are a student preparing for exams or someone curious about human physiology, learning how to interpret a cellular respiration diagram will give you a deeper appreciation of the microscopic processes that power life.